amcjの「多角形シンセの魔力」講座で多角形シンセというものの存在を知り、面白かったので自分なりに理解した内容のまとめと、SuperColliderで実装するにはどうしたらよいのか実験してみました。
多角形シンセシスとは?
多角形シンセシスの技術を採用したPolygogoという製品のサイトに分かりやすいgifがありました。
多角形をプロットした軌跡を波形として扱うことで音を作る、というのが多角形シンセシスの方式です。
gifはpolygogoのサイトより引用:https://umbrella-company.jp/e-rm-polygogo.html
多角形から波形を取り出すのが多角形シンセシスの方式ですが、逆に繰り返している音の波形をグラフ上に写し取るとなんらかの図形になるわけです(サイン波の場合は円になる)。
SuperColliderで実装する
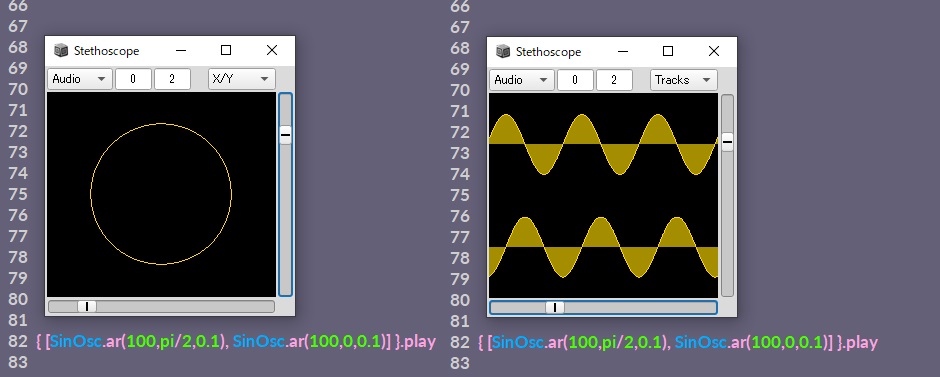
この図形をSuperColliderのScopeで表示させてみます。Scopeのスタイルからlissajou(X / Y)を選ぶと、0(ステレオのleft)チャンネルの波形をX軸、1(ステレオのright)チャンネルの波形をY軸で描画する方式になります。
以下のようにステレオの左と右にそれぞれ位相をずらしたサイン波を出力することでScopeに円を描くことができました。
このように単振動を組み合わせたときに描かれる図形はリサジュー図形といわれます。
しかし最初に貼ったgifの通り、多角形シンセシスの実装では、中心から伸びる直線をぐるぐる回して、時間ごとのその先っぽの座標をx-y軸上にプロットしているのでした。
直線をぐるぐる回す部分を実装するために、周期的に0から2piまでを動く角度が必要になるので、SuperColliderではPhasorというUGenを使うとよさそうです。
({
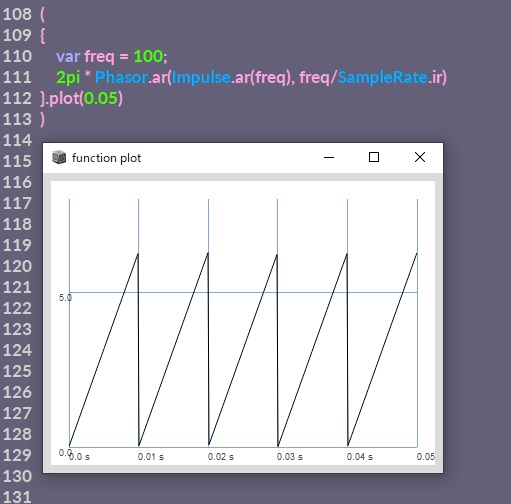
//phasorの数値を0.05秒ぶんプロットして確認する
var freq = 100;
2pi * Phasor.ar(Impulse.ar(freq), freq/SampleRate.ir)
}.plot(0.05)
)
freqの周波数の周期で0から2piまで上がっては0に戻る、という波形をPhasorで作っています(ここではfreqを100にしているので、つまり1秒間に100回0~2piまでが繰り返される)
このfreqがそのまま多角形シンセのピッチになります。
Phasorで作った角度をつかって、円をプロットしてみます。
({
var freq = 400, phi;
    phi = 2pi * Phasor.ar(Impulse.ar(freq), freq/SampleRate.ir);
    x = cos(phi);
    y = sin(phi);
    [x, y];
}.play
)
Scopeでプロットしてみると円が描画されます。
ここでは単純にsinとcosを使って円を作ってみましたが、多角形の式はもうちょっと複雑になります。ポリゴナルシンセシスについての論文のなかの以下の部分が実装する式です。
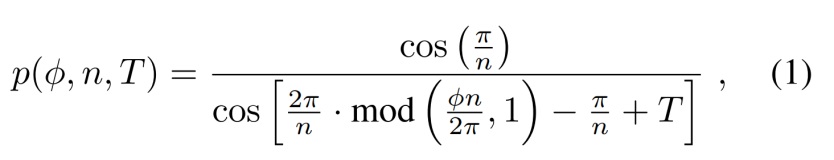
continuous-order-polygonalwaveform-synthesis.pdf (umich.edu)より引用
ここでは数学的な読み解きはすっとばして(amcjで配布されていた解説資料がとても分かりやすかったのですが、表には出てない?ようなので。。)、とりあえず式を見たまんま実装する、という部分だけここではやることにします。
まずは、単純な多角形を作る式を実装してみます。
(
SynthDef(\polySynth, {
    arg n=4, freq=100, amp=0.5;
    var p, x, y, phi, theta_zero, theta;

    //角度を作る
    phi = 2pi * Phasor.ar(Impulse.ar(freq), freq/SampleRate.ir);
    //多角形の式
    p = cos(theta_zero) / cos(theta - theta_zero);
    theta_zero = pi / n;
    theta = 2 * theta_zero * ((phi * n / 2pi) % 1.0);
    //x, y軸の計算
    x = p * cos(phi);
    y = p * sin(phi);
    //出力
    Out.ar(0, [x, y]*amp);
}).add;
)
phiはさっきやった0~2piまでの値、pは中心点から図形の輪郭までの距離を計算する式です。引数のnが角数になっているので、nを4にすると四角形、5にすると五角形が描画されます。
これが基本になりますが、polygogoでは音色の幅を出すために他にもいじれるパラメータがあります。パラメータを追加すると以下のようになります。
(
SynthDef(\polySynth, {
	arg n = 4, freq = 20, teeth = 0, fold = 1, roll = 0, amp = 0.5;;
	var p, x, y, phi, theta_zero, theta, rotate;

	theta_zero = pi / n;
	phi = 2pi * Phasor.ar(Impulse.ar(freq), freq/SampleRate.ir);
	rotate = 2pi * Phasor.ar(Impulse.ar(roll), roll/SampleRate.ir);

	t = (pi * (n - 2)) / (2 * n) * teeth;
	theta = 2 * theta_zero * ((phi * n / 2pi) % 1.0);
	p = cos(theta_zero + t) / cos(theta - theta_zero + t);
	x = p * cos(phi + rotate);
	y = p * sin(phi + rotate);
	x = Fold.ar(fold * x, -1, 1);
	y = Fold.ar(fold * y, -1, 1);

	Out.ar(0, [x, y]*amp);
}).add;
)
追加したパラメータは以下のように作用します。
- teeth・・・辺の部分を中心に絞って 歯車っぽい形にする
- fold・・・端で折り返してぐちゃぐちゃっとした図形にする
- roll・・・図形を回転させる
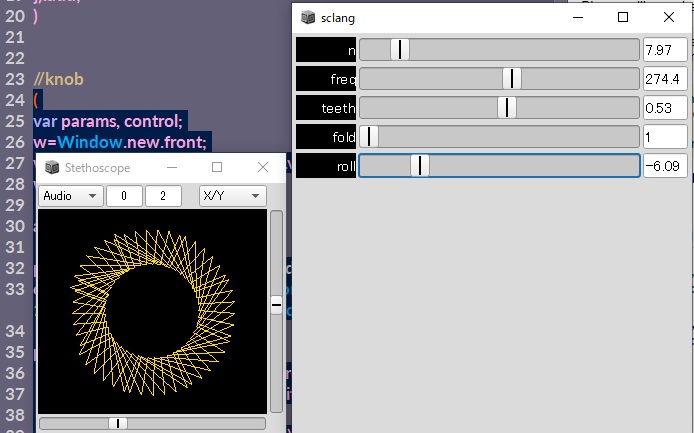
以下はGuiで操作できるようにしたコードです。実行すると、スライダーを操作しながら多角形の形の変化を確認できます。
(
var params, control;
w=Window.new.front;
w.view.decorator=FlowLayout(w.view.bounds);
w.view.decorator.gap=2@4;

a = Synth(\polySynth);

params = ["n", "freq", "teeth", "fold", "roll"];
control = [ControlSpec(2.1,50), ControlSpec(1,500), ControlSpec(0, 1),ControlSpec(1, 10), ControlSpec(-10, 10)];

params.collect{ |item, i|
    EZSlider(w, 392@25, item, control[i], layout:\horz)
    .setColors(Color.black,Color.white)
    .font_(Font("Helvetica",15))
    .action_({ |v| a.set(item, v.value)});
};
)
応用編
ここまでやってきて、中心点からの距離を計算する式さえあれば(かつそれを-1~1の範囲に収めれば)、どんな図形でも波形にできそうだということに気付きます。
ためしに、Wolframのサイトからハートの方程式を持ってきて、シンセにしてみました。
({
    var freq=400, phi, rotate=1.5pi, amp;
    phi = 2pi * Phasor.ar(Impulse.ar(freq), freq/SampleRate.ir);
    //ハートの式
    r = 2 - (2 * sin(phi)) + ( (sin(phi)) *  (sqrt(abs(cos(phi)))) / (sin(phi)+1.4) );
    //x, y座標
    x = r * sin(phi + rotate);
    y = r * cos(phi + rotate) + 1;
    [x, y]*amp
}.play
)
さらに、svgファイルとかの図形を読み込むことが出来ればもっと複雑な図形もシンセに出来そうだなあ。。ということで、方法を考えてみました。
まずシンセとして使いたい図形の座標データが必要なので、そこはProcessingで抽出することにします。
使うsvg画像は、輪郭線だけの、一筆書きのようなデータが好ましいです。今回は素材サイトからこちらの猫の画像を使ってみます。

processingのスケッチがあるフォルダーに「data」フォルダーを作り、その中にsvgデータを配置します。
画像のx座標、y座標をそれぞれリストとしてtxtファイルに吐き出すコードをProcessingで実行します。
PShape img;

void setup() {
  size(400, 400);
  String fileName1 = "itemList_y.txt";
  String fileName2 = "itemList_x.txt";
  img = loadShape("cat.svg");
  PShape child = img.getChild(1);
  shape(child);
  int total = child.getVertexCount();
  String[] x = new String[total];
  String[] y = new String[total];

  for(int i=0; i<total; i++){
    x[i] = str(child.getVertex(i).x);
    y[i] = str(child.getVertex(i).y);
  }
  saveStrings( fileName1, y );
  saveStrings( fileName2, x );
}
座標データのファイル(itemList_y.txt, itemList_x.txt)が出来たら、SuperColliderのプロジェクトファイルがあるフォルダーに「data」フォルダを作成し、その中に移します。
まずはSuperColliderでtxtファイルから座標データを取り出し、x, yに配列として格納します。
///座標ファイル読み込み
(
var path = PathName(thisProcess.nowExecutingPath).parentPath;
var pathx = path ++  "/data/itemList_x.txt";
var pathy = path ++  "/data/itemList_y.txt";
var readx = TabFileReader.read(pathx, true, true);
var ready = TabFileReader.read(pathy, true, true);
y = [];
x = [];
ready.collect({ |item, i|
	y = y.add(item[0].asFloat);
});
readx.collect({ |item, i|
	x = x.add(item[0].asFloat);
});
//-1~1の範囲に収める
x = x.normalize - 0.5;
y = y.normalize - 0.5;
)
配列の座標データをBufferに格納し、BufRdで読み出します。
(
SynthDef(\cat, {
	arg freq = 10;
	var buf1, buf2, out1, out2;
	var env1 = Env(x).asSignal(44100);
	var env2 = Env(y).asSignal(44100);
	buf1 = Buffer.alloc(s, 44100);
	buf2 = Buffer.alloc(s, 44100);
	buf1.loadCollection(env1);
	buf2.loadCollection(env2);
	out1 = BufRd.ar(1, buf1, (Phasor.ar(0, freq, 0, 44100)));
	out2 = BufRd.ar(1, buf2, (Phasor.ar(0, freq, 0, 44100)));
	Out.ar(0, [out1, out2]);
}).add;
)
Synth(\cat);
これで猫の画像をscopeに描画するところまでは完成です。
左右のチャンネルの波形を馴染ませるため、図形を回転させたいとおもいます。
さっきのbufferに格納したデータを一旦別の(出力チャンネルではない)バスに送る→バスからいっこずつデータを取り出して行列回転の計算をする→出力する。という手順で実装してみました。もっと他にいいやり方があるかもしれませんが。。
//busに座標データ送る
~busx = Bus.audio(s, 1);
~busy = Bus.audio(s, 1);
(
SynthDef(\bus, {
	arg freq = 100;
	var buf1, buf2, out1, out2;
	var env1 = Env(x).asSignal(44100);
	var env2 = Env(y).asSignal(44100);
	buf1 = Buffer.alloc(s, 44100);
	buf2 = Buffer.alloc(s, 44100);
	buf1.loadCollection(env1);
	buf2.loadCollection(env2);
	out1 = BufRd.ar(1, buf1, (Phasor.ar(0, freq, 0, 44100)));
	out2 = BufRd.ar(1, buf2, (Phasor.ar(0, freq, 0, 44100)));
	Out.ar(~busx, out1);
 	Out.ar(~busy, out2);
}).add;
)

//座標データを取得して回転を計算
(
SynthDef(\calc, {
	arg roll = 1;
	var sigx, sigy, outx, outy, phi;
	phi = 2pi * Phasor.ar(Impulse.ar(roll), roll/SampleRate.ir);
	sigx = In.ar(~busx, 1);
	sigy = In.ar(~busy, 1);
	outx =  (sigx*cos(phi)) + (sigy*(-1)*sin(phi));
	outy =  (sigx*sin(phi)) + (sigy*cos(phi));
	Out.ar(0, [outx, outy]);
}).add;
)

a = Synth(\bus);
b = Synth.after(a, \calc);
a.set(\freq, 200);
b.set(\roll, 10);
実際に動かしてみたのがこれです↓